What's Six Sigma?
- Owen Nash
- Feb 3
- 4 min read
What is Six Sigma?
A data-driven methodology to improve processes by reducing defects and variability.
Goal: Achieve near-perfect quality with 3.4 defects per million opportunities (DPMO).
Focuses on process improvement, efficiency, and customer satisfaction.
Key Principles:
Customer Focus – Understand and meet customer needs.
Data-Driven Decisions – Use facts, not guesses.
Process Improvement – Identify root causes of problems.
Proactive Management – Prevent issues before they happen.
Team Collaboration – Involve cross-functional teams.
Continuous Improvement – Always look for ways to do better.
DMAIC Framework (for existing processes):
Define: Identify the problem and project goals.
Measure: Collect data to understand current performance.
Analyze: Find root causes of issues.
Improve: Develop and implement solutions.
Control: Maintain improvements over time.
Real-Life Examples:
Manufacturing: Reducing defects in car parts production.
Healthcare: Minimizing medication errors in hospitals.
Banking: Reducing errors in loan processing times.
Retail: Improving supply chain efficiency to reduce stockouts.
Common Six Sigma Tools
Process Mapping: Visualizes process flow to identify bottlenecks.
Fishbone Diagram (Ishikawa): Finds root causes of problems.
Pareto Chart: Focuses on the most critical issues (80/20 rule).
Control Charts: Monitors process stability over time.
FMEA (Failure Modes and Effects Analysis): Identifies potential failures and their impact.
Histogram: Shows data distribution to spot trends.
5 Whys: Identifies the root cause by asking “Why?” repeatedly.
Cause & Effect Matrix: Links causes to their effects based on importance.
Value Stream Mapping: Highlights value-added and non-value-added steps.
SIPOC Diagram: Defines Suppliers, Inputs, Process, Outputs, Customers.
Tags:
📊 Sample of a Cause & Effect Matrix (C&E Matrix)
Scenario:
A restaurant is receiving customer complaints about slow service. The goal is to prioritize the process factors that most impact customer satisfaction.
Step 1: Identify Key Customer Requirements (CTQs)
CTQs (Critical to Quality):
Quick Service
Accurate Orders
Friendly Staff
Food Quality
Step 2: List Process Inputs (Causes)
Causes (Process Factors):
A) Staff Training
B) Order Taking Process
C) Kitchen Workflow
D) Inventory Management
E) Communication Between Staff
Step 3: Assign Importance Ratings
Rate CTQs on importance to the customer (1 = Low, 5 = High).
Rate how strongly each cause affects the CTQ (0 = No impact, 1 = Low, 3 = Medium, 9 = High).
Cause & Effect Matrix
Process Causes | Quick Service (5) | Accurate Orders (4) | Friendly Staff (3) | Food Quality (5) | Total Score |
A) Staff Training | 3 × 5 = 15 | 9 × 4 = 36 | 9 × 3 = 27 | 3 × 5 = 15 | 93 |
B) Order Taking Process | 9 × 5 = 45 | 9 × 4 = 36 | 3 × 3 = 9 | 1 × 5 = 5 | 95 |
C) Kitchen Workflow | 9 × 5 = 45 | 3 × 4 = 12 | 1 × 3 = 3 | 9 × 5 = 45 | 105 |
D) Inventory Management | 3 × 5 = 15 | 1 × 4 = 4 | 0 × 3 = 0 | 9 × 5 = 45 | 64 |
E) Staff Communication | 9 × 5 = 45 | 9 × 4 = 36 | 3 × 3 = 9 | 3 × 5 = 15 | 105 |
✅ Analysis & Interpretation:
Highest Scores:
C) Kitchen Workflow = 105
E) Staff Communication = 105
These factors have the greatest impact on customer satisfaction and should be prioritized for improvement.
🎯 Next Steps:
Focus on optimizing kitchen workflow (e.g., streamline food prep processes).
Enhance staff communication (e.g., implement better coordination tools or training).
Reassess after improvements to measure impact on customer satisfaction.
Sample of FMEA (Failure Modes and Effects Analysis)
Let’s consider an example of a coffee machine manufacturing process to identify potential failures.
📋 FMEA Table for Coffee Machine Assembly
Process Step | Potential Failure Mode | Potential Effect of Failure | Severity (1-10) | Potential Causes | Occurrence (1-10) | Current Controls | Detection (1-10) | RPN (Risk Priority Number) | Recommended Actions |
Assemble Heating Unit | Loose electrical connection | Machine won’t heat properly | 8 | Poor soldering technique | 6 | Visual inspection | 5 | 240 | Improve soldering training; add automated testing |
Install Water Pump | Pump leakage | Water damage to internal parts | 9 | Faulty pump seal | 4 | Leak test after assembly | 4 | 144 | Use higher-quality seals; increase leak tests |
Attach Control Panel | Unresponsive buttons | User cannot operate machine | 7 | Poor electrical contact | 5 | Manual function check | 6 | 210 | Automate functional tests; enhance inspection |
Final Assembly | Loose screws | Machine parts fall apart | 6 | Inconsistent torque application | 7 | Random quality checks | 4 | 168 | Use torque wrenches with sensors; 100% checks |
Packaging | Inadequate padding | Product damage during shipping | 5 | Incorrect packaging materials used | 3 | Final visual check before shipping | 6 | 90 | Update packaging guidelines; regular audits |
⚡ Key Metrics Explained:
Severity (S): Impact of the failure on the customer (1 = low, 10 = catastrophic).
Occurrence (O): Likelihood of the failure happening (1 = rare, 10 = frequent).
Detection (D): Ability to detect the failure before it reaches the customer (1 = easy to detect, 10 = hard to detect).
RPN (Risk Priority Number): RPN = S × O × D (used to prioritize issues).
✅ How to Use This FMEA:
Identify High-RPN Areas: Focus on risks with the highest RPN (e.g., Loose electrical connection with RPN 240).
Take Corrective Actions: Implement the recommended actions to reduce the severity, occurrence, or improve detection.
Review & Update: After actions are taken, reassess RPN to confirm risk has been reduced.
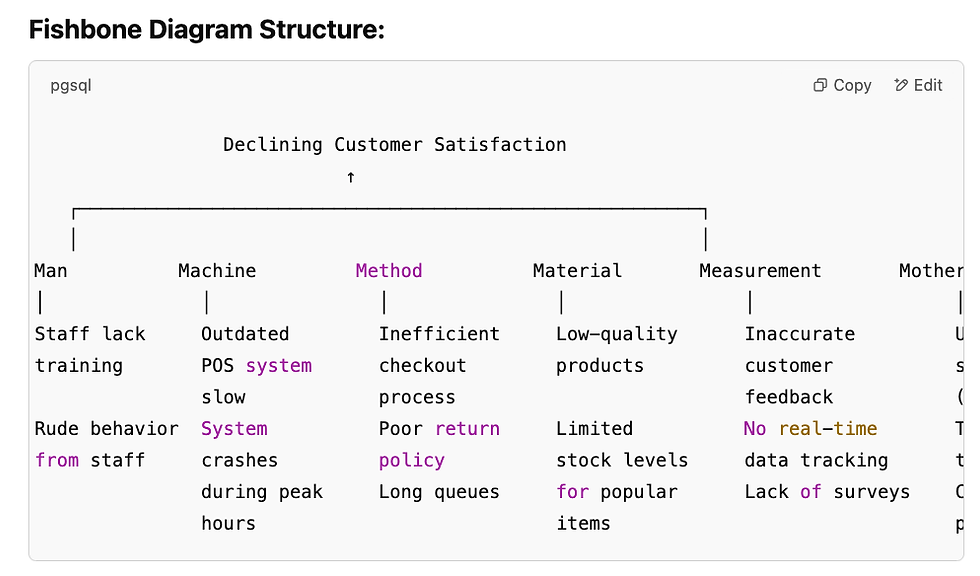
🐟 Sample of a Fishbone Diagram (Ishikawa Diagram)
Scenario:
A retail store is facing an issue with declining customer satisfaction. The goal is to identify the root causes.
Main Problem:
🎯 Declining Customer Satisfaction
Categories (6 Ms):
Man (People)
Machine (Technology/Equipment)
Method (Processes/Procedures)
Material (Products/Resources)
Measurement (Data/Feedback)
Mother Nature (Environment)
Fishbone Diagram Structure:
Comments